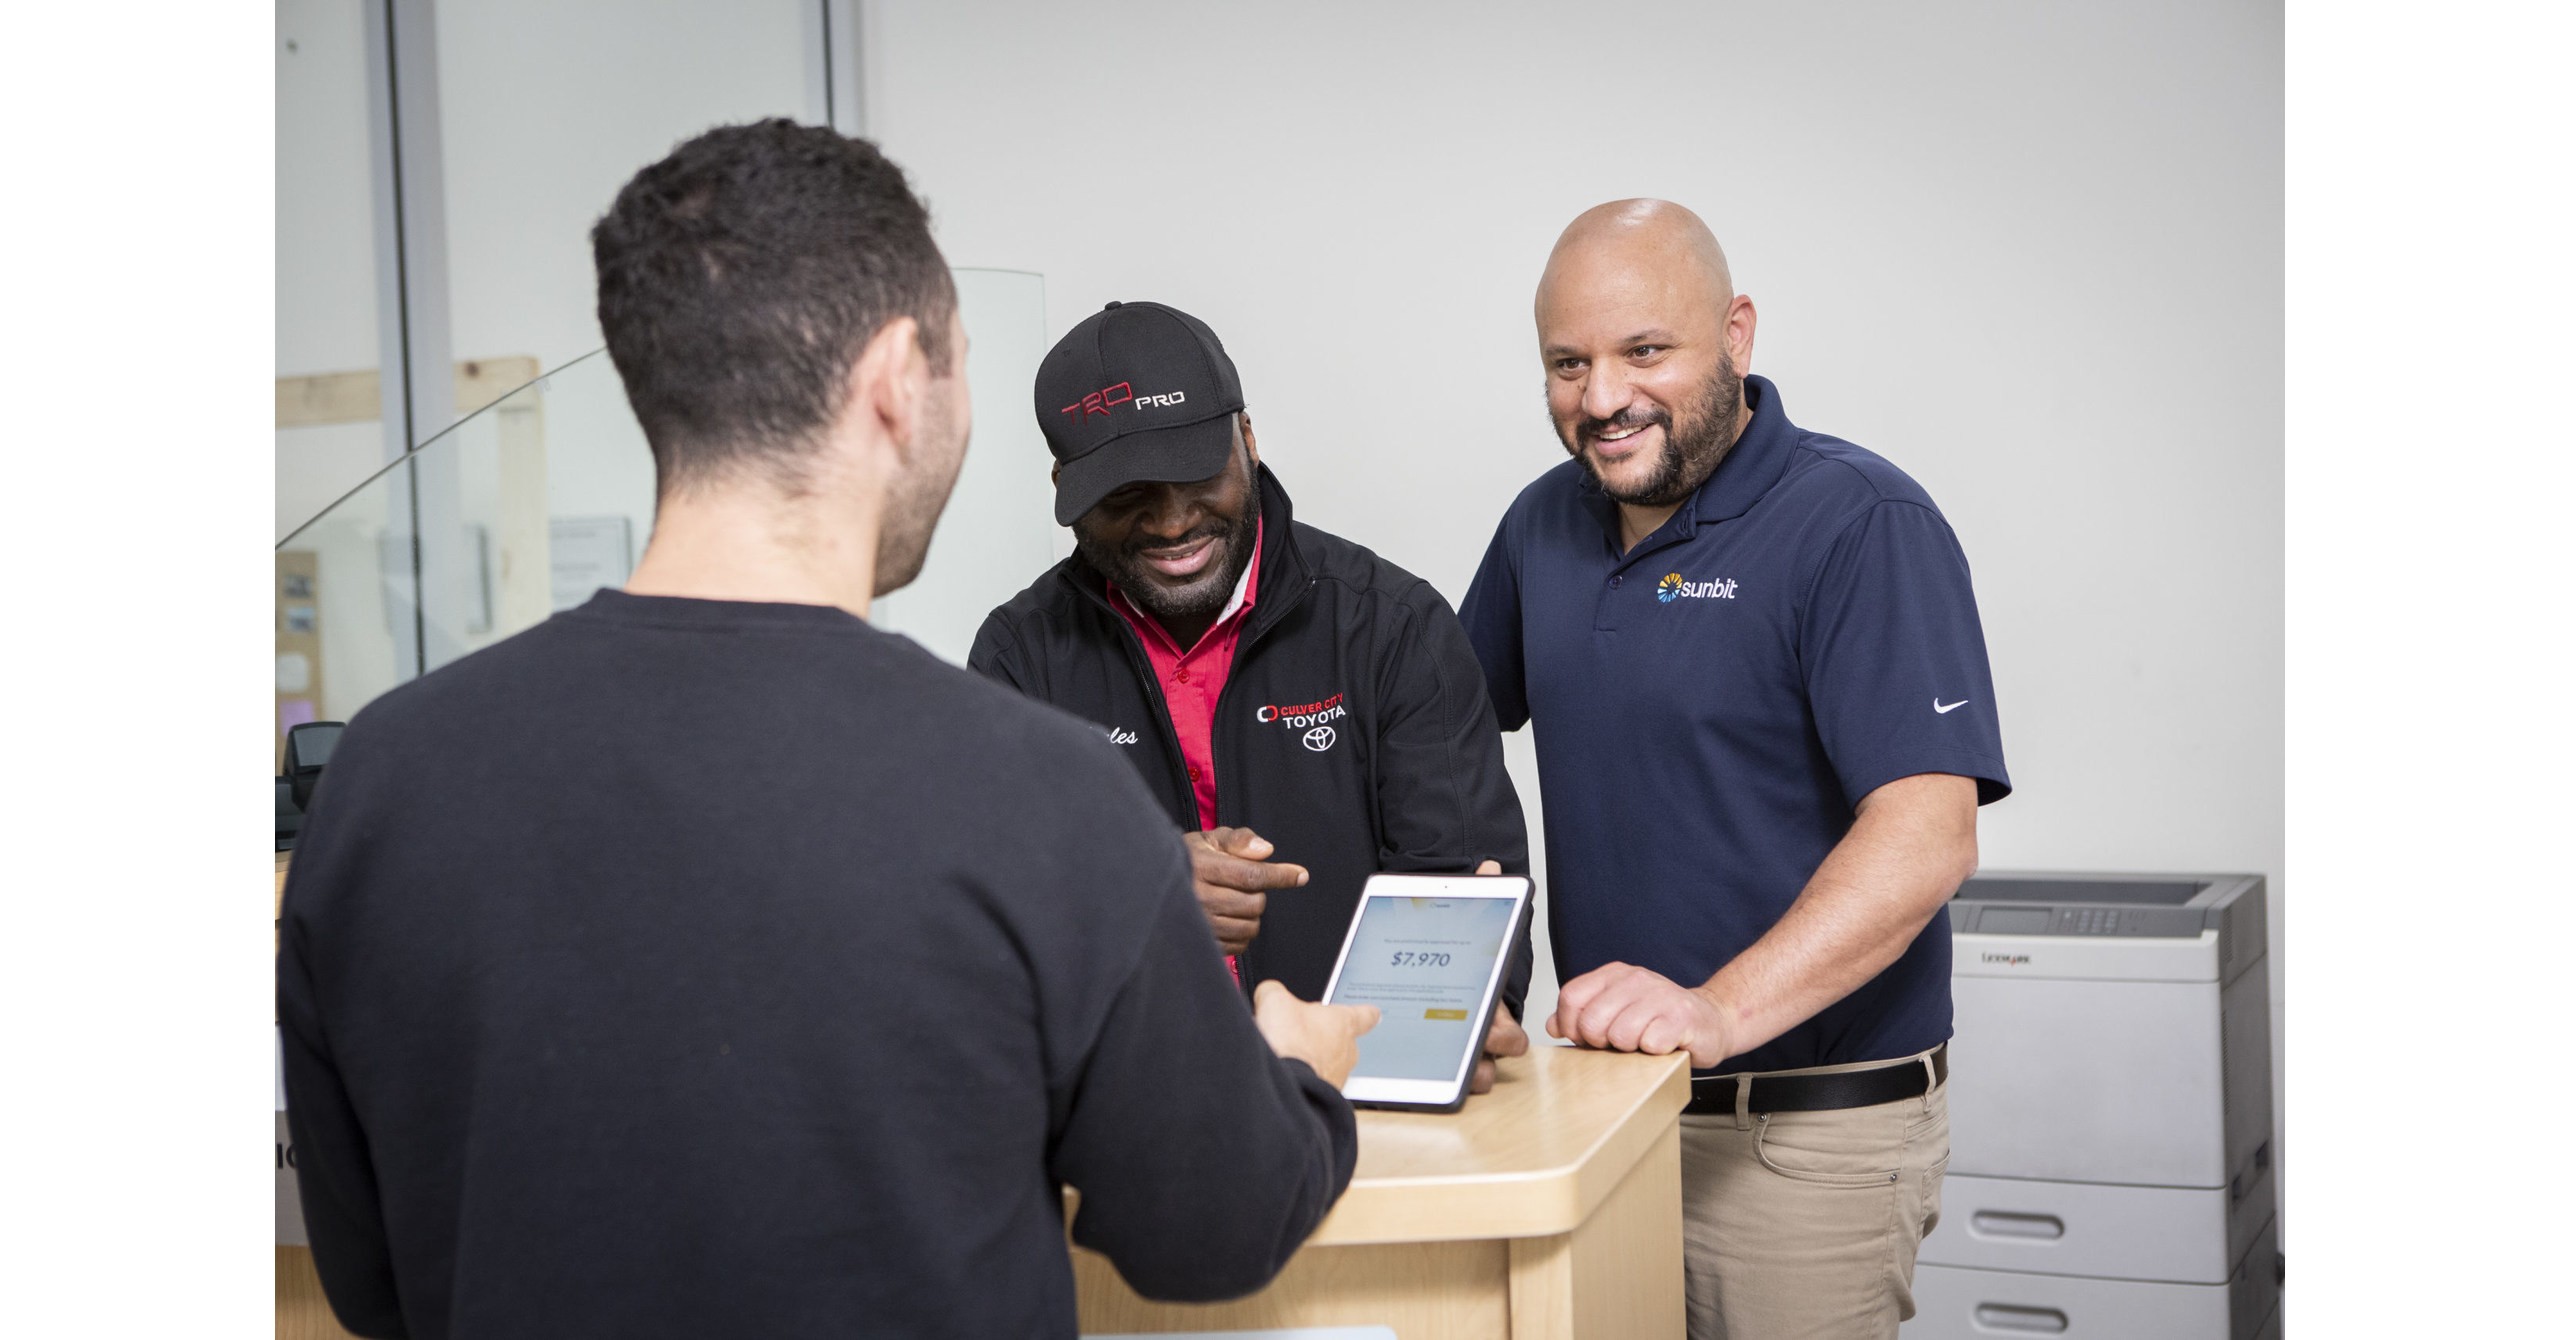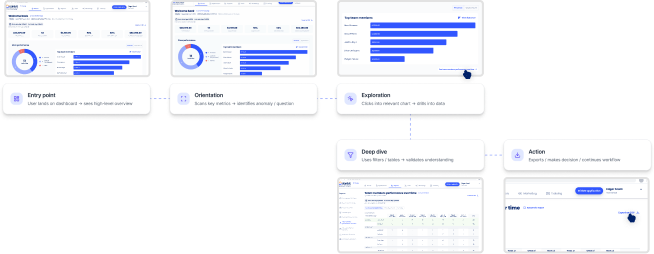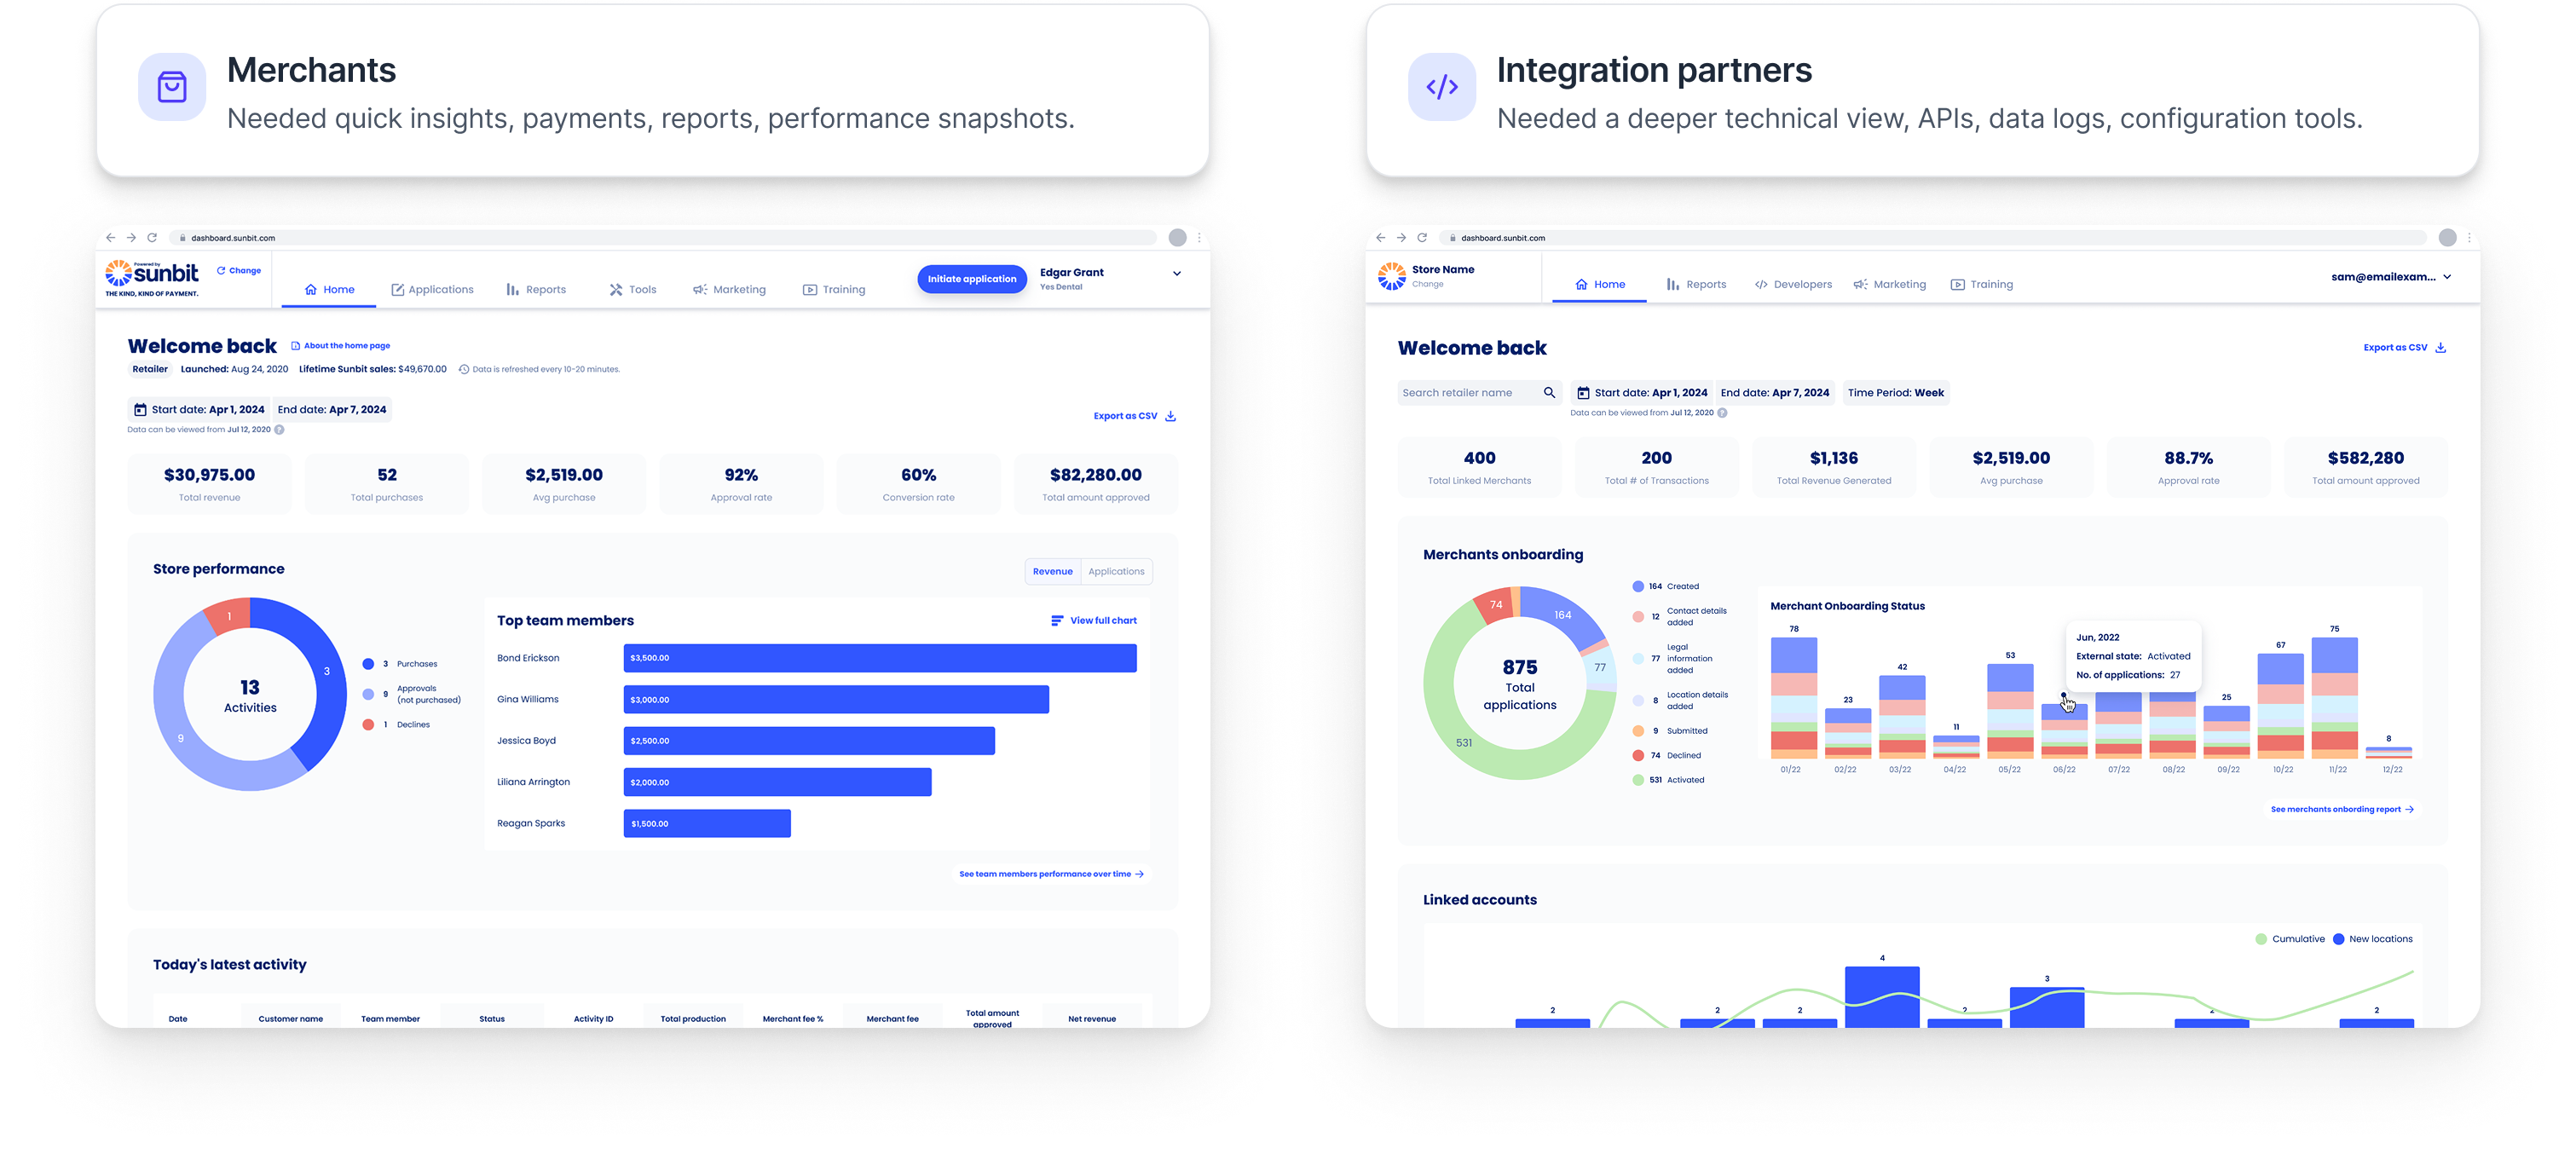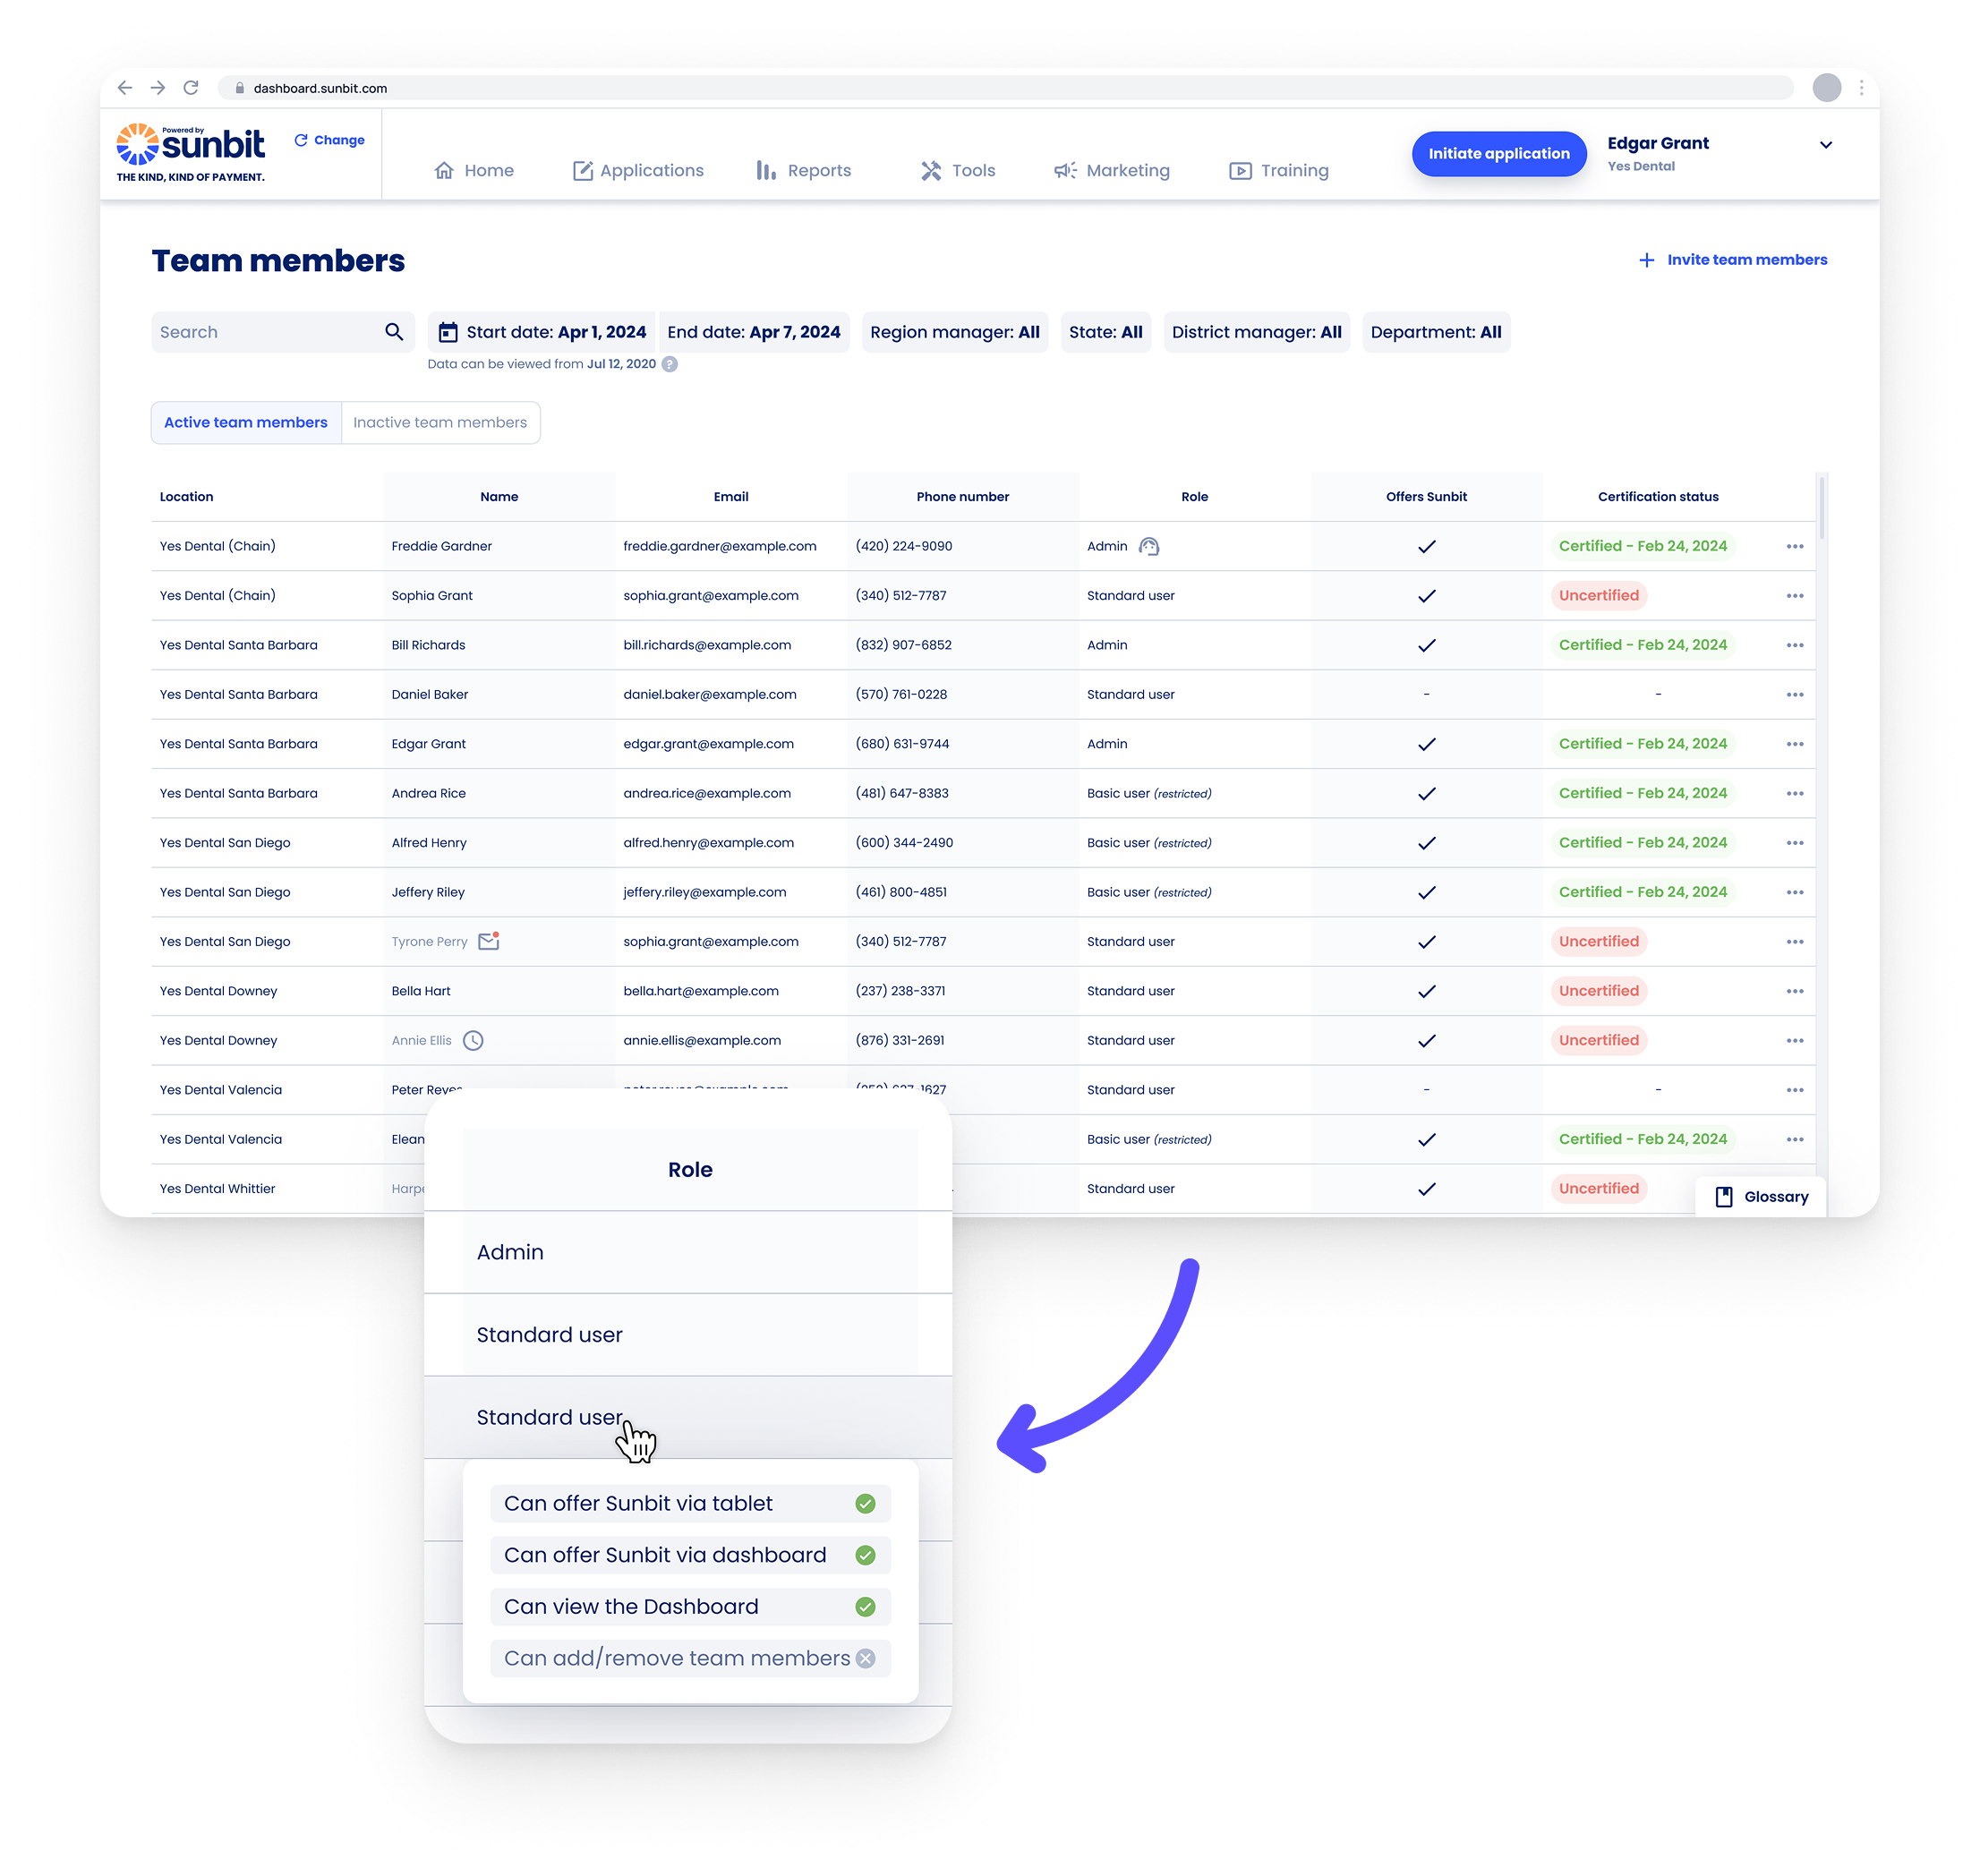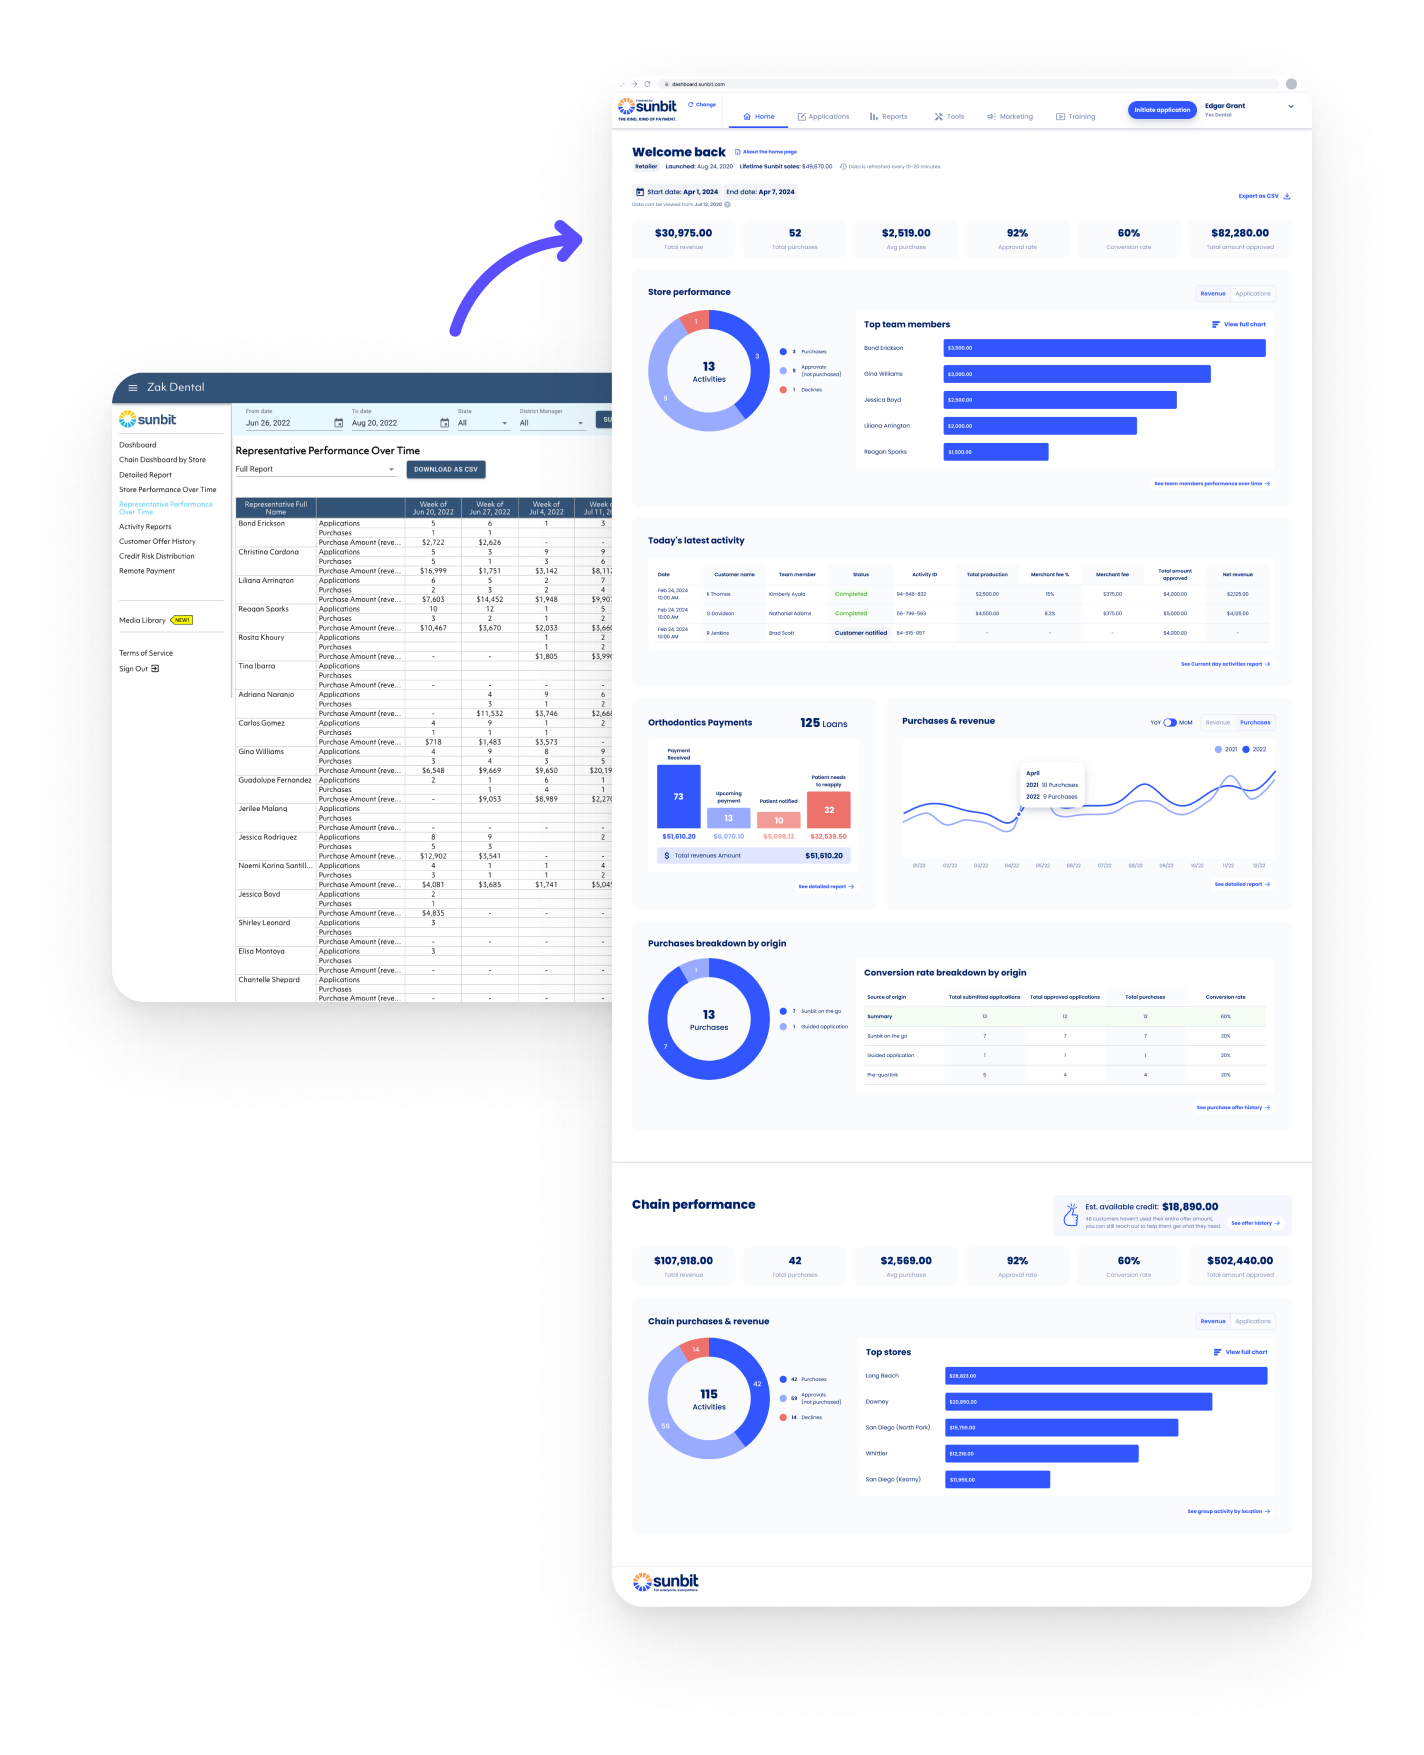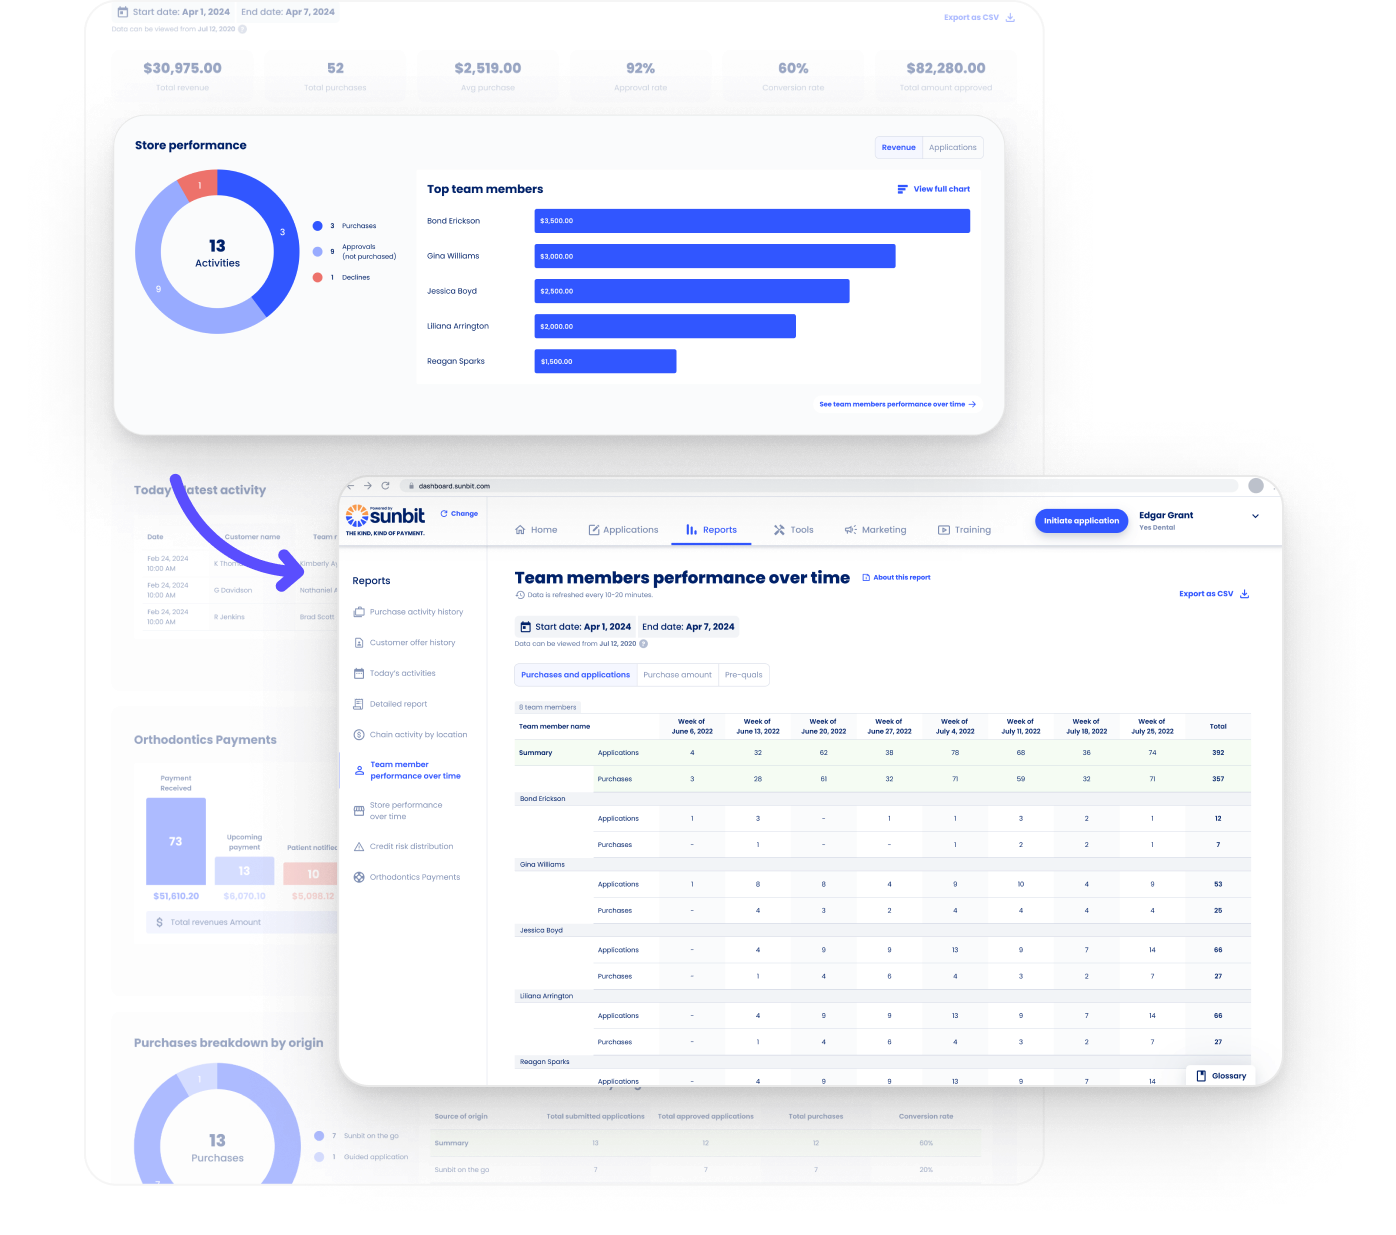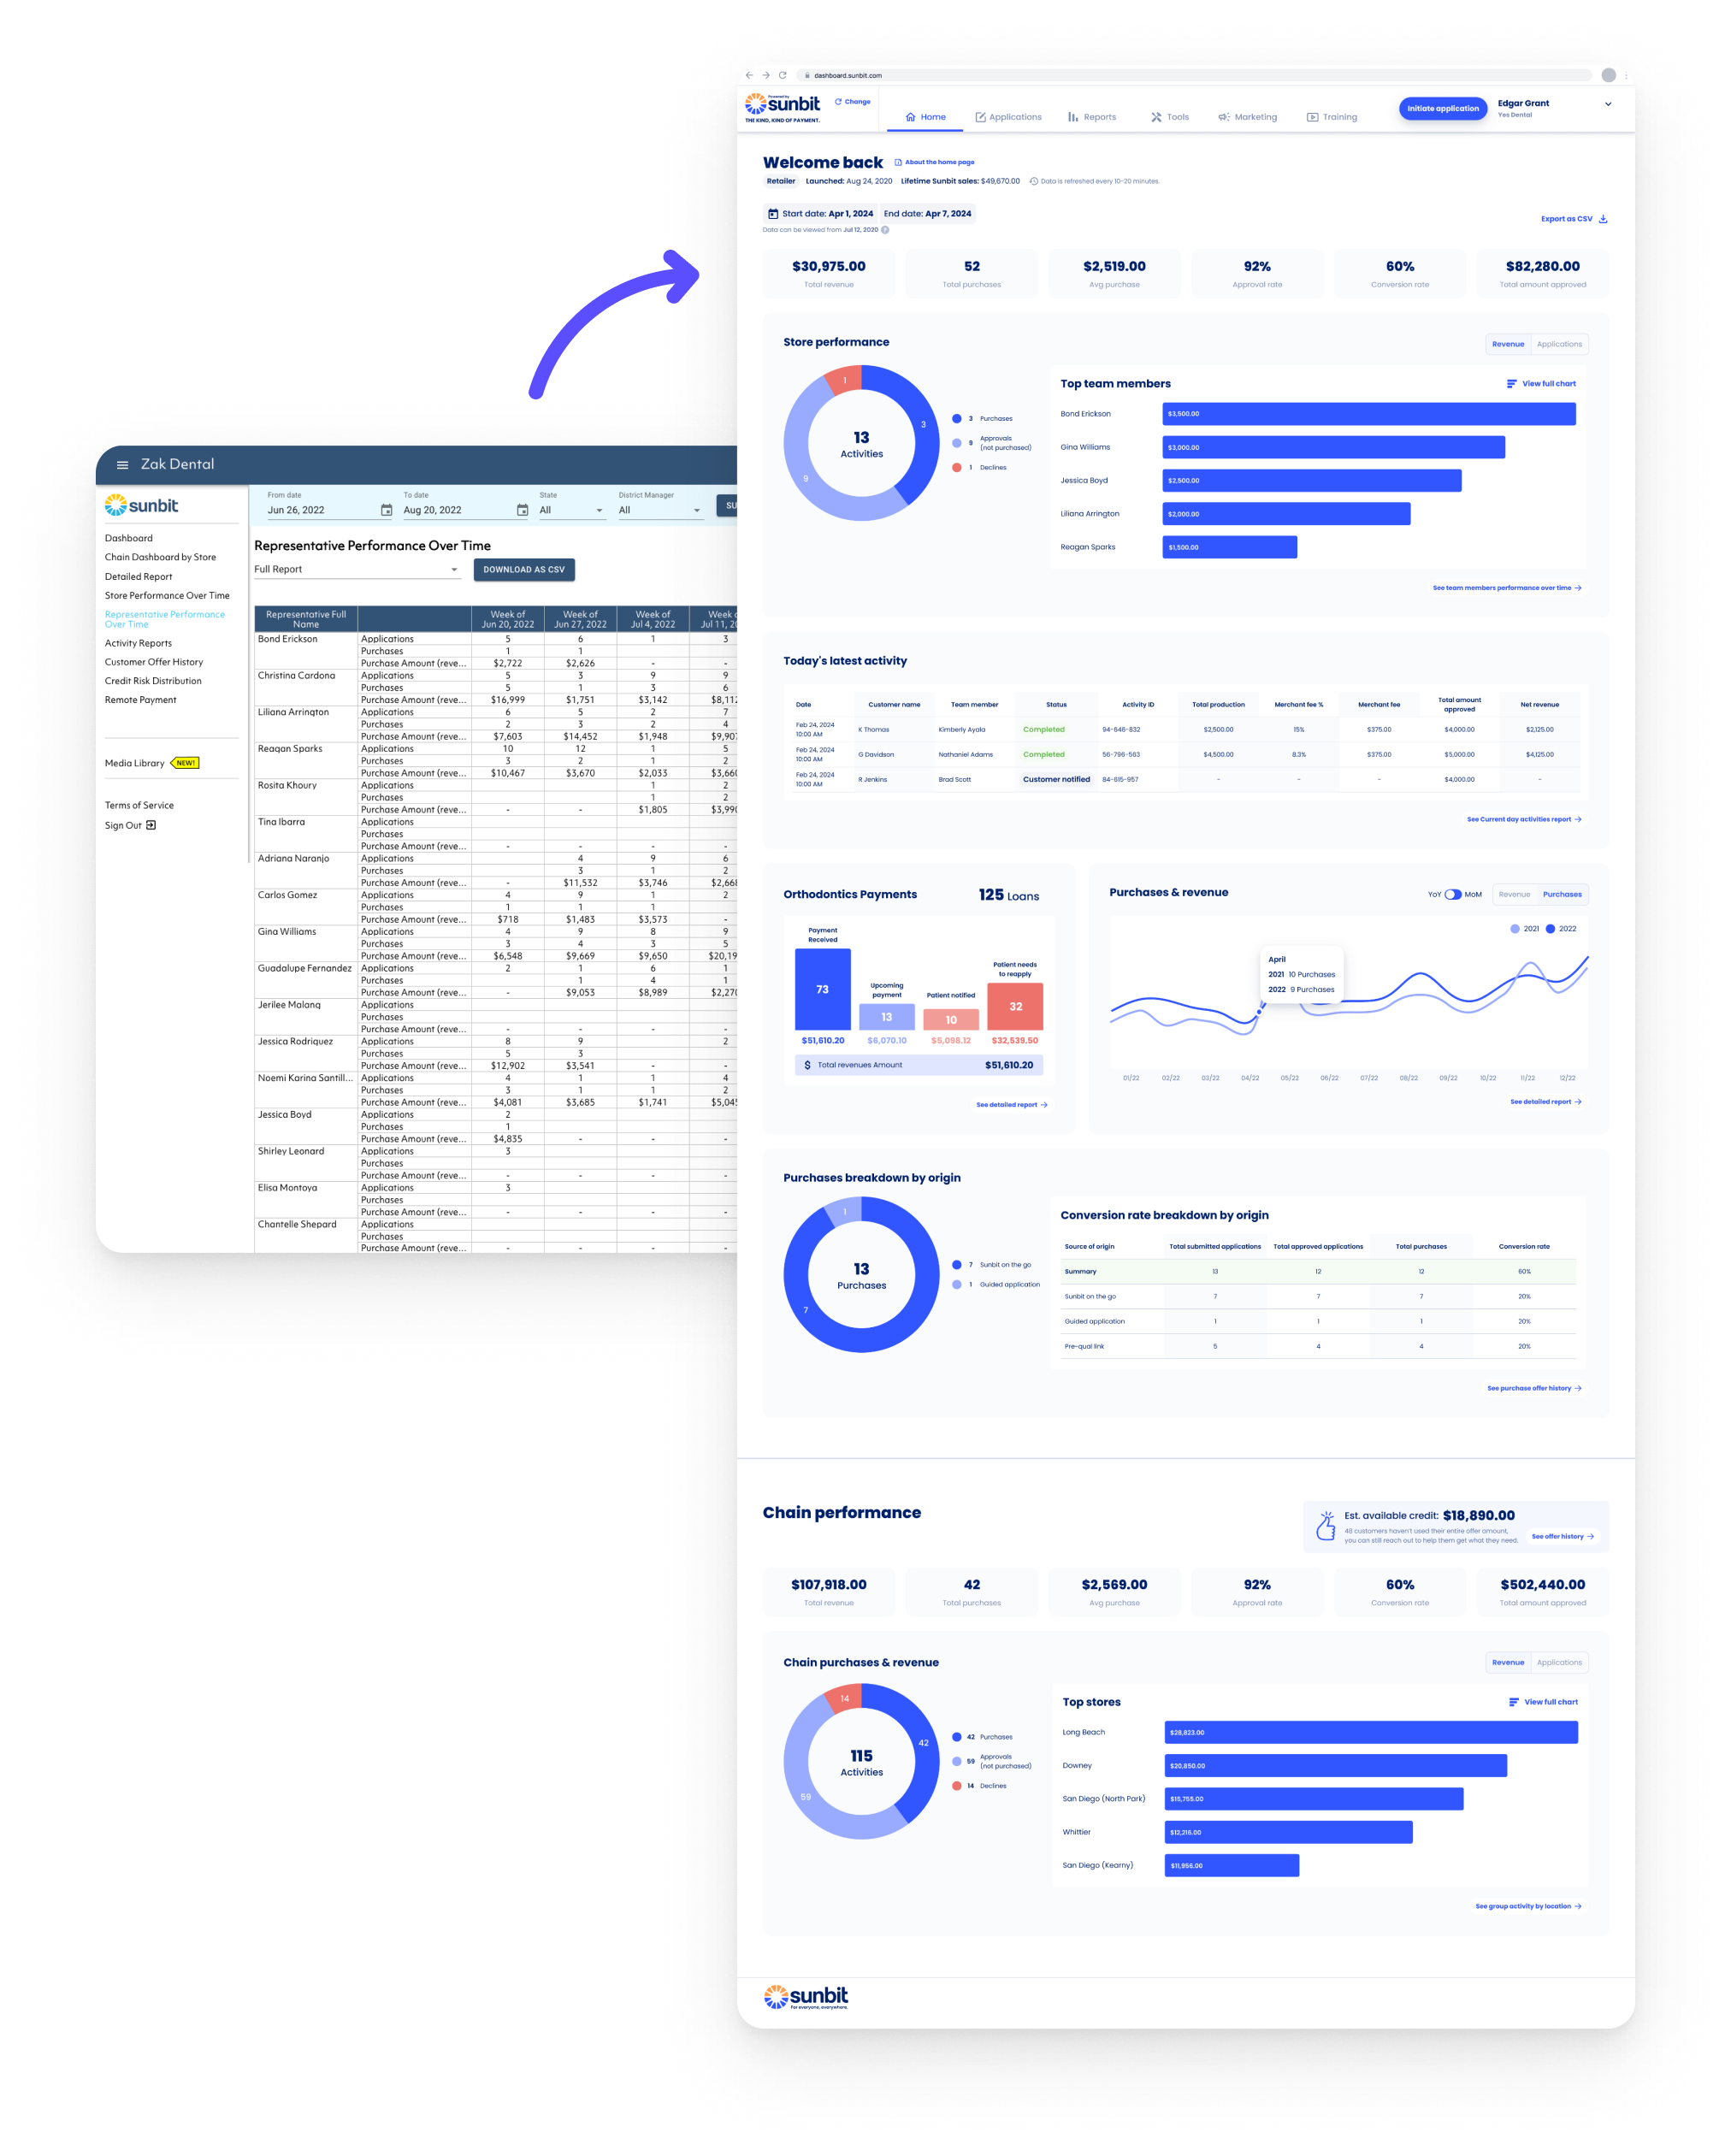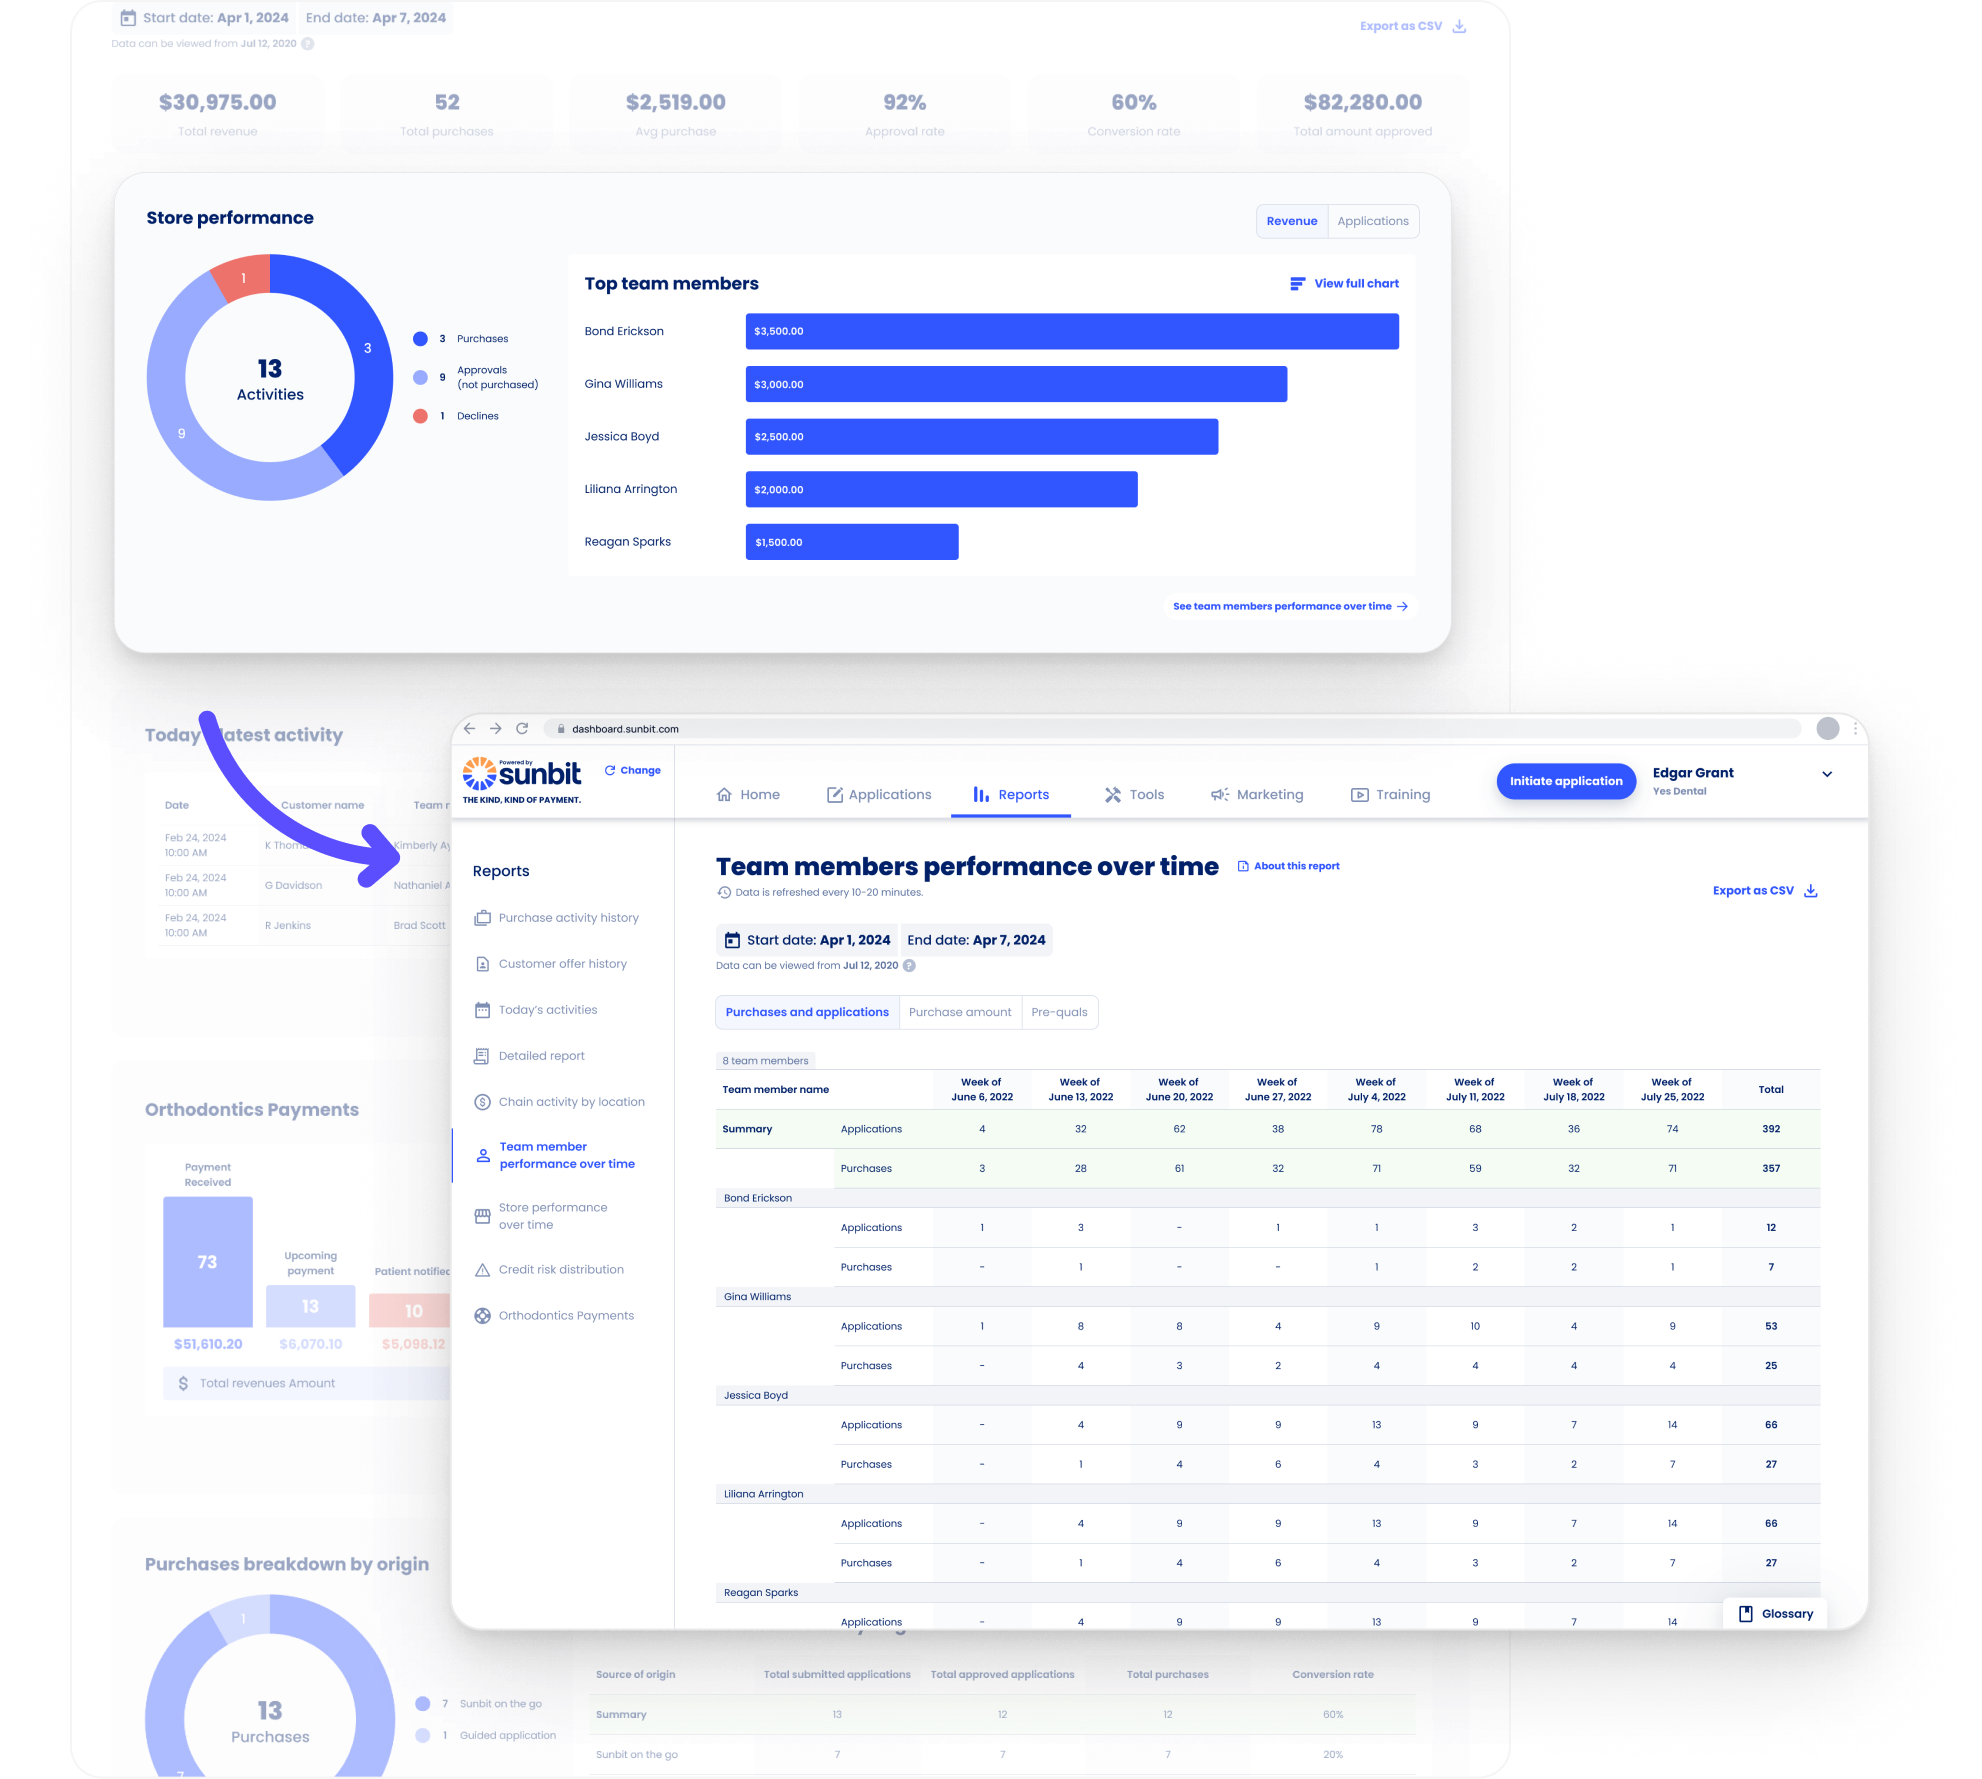

The process
We started with a discovery phase, interviewing ~65 partner businesses, reviewing their daily workflows, and collecting feedback from internal
support teams.
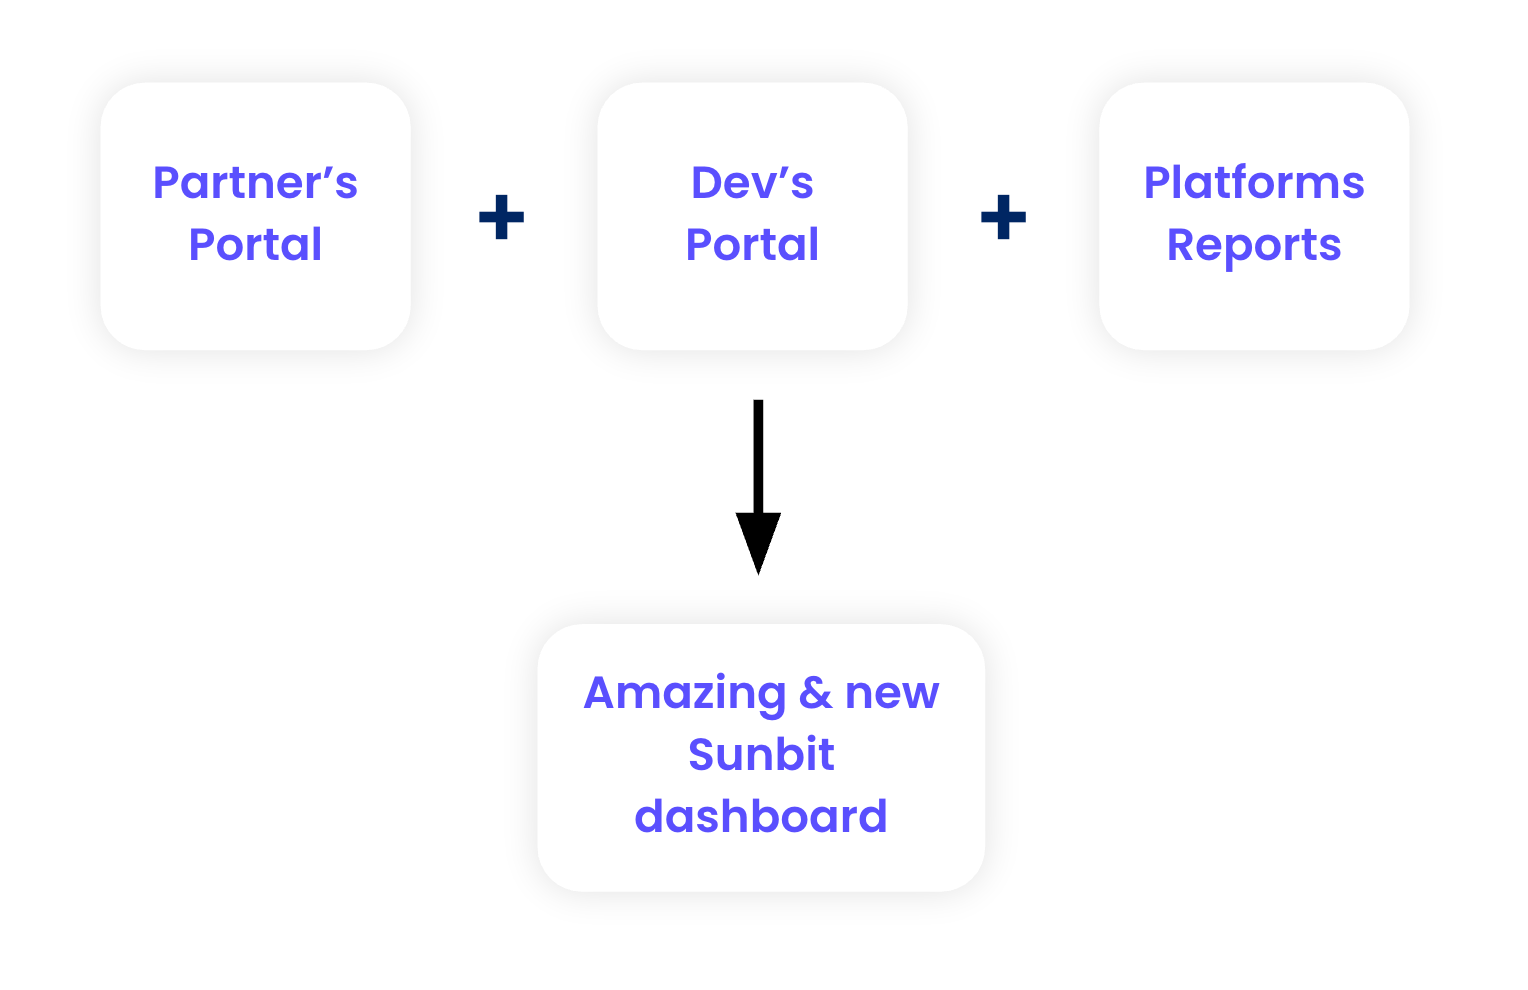
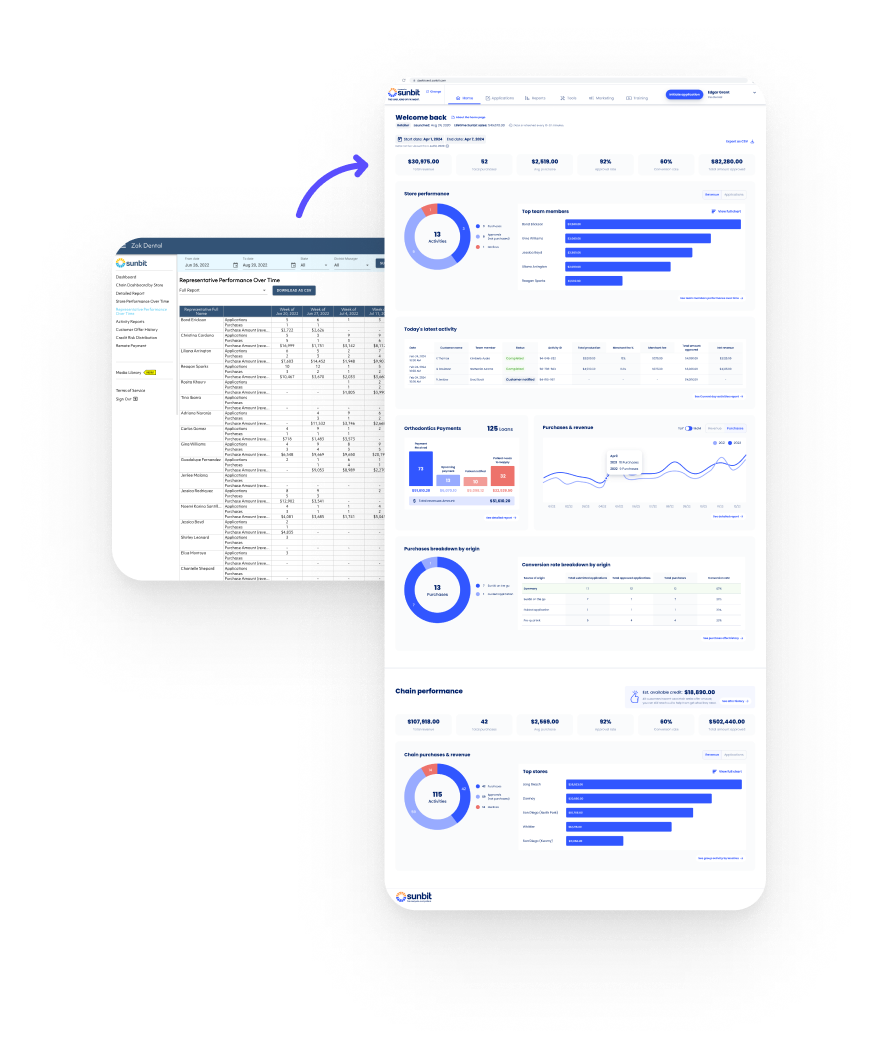
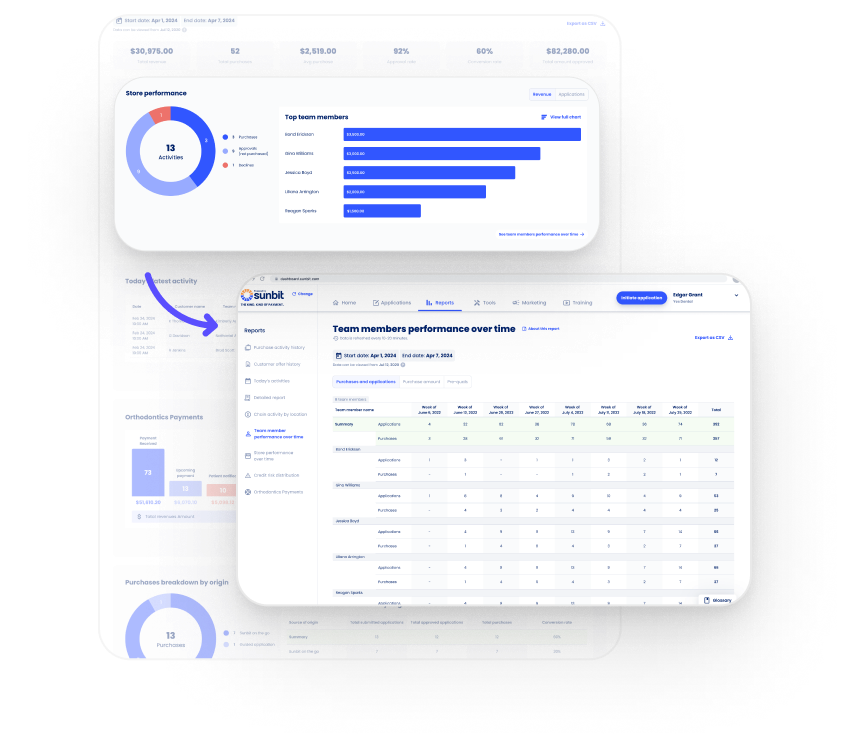
That insight shaped a very clear direction:
- Simplify reporting
- Make data actionable
- Give users control